Guide to SAT Math Problem Solving and Data Analysis + Practice Questions
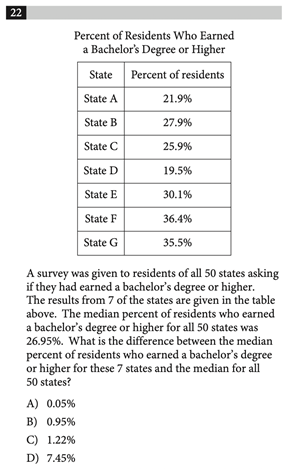
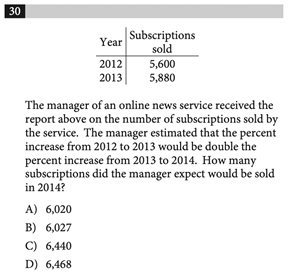
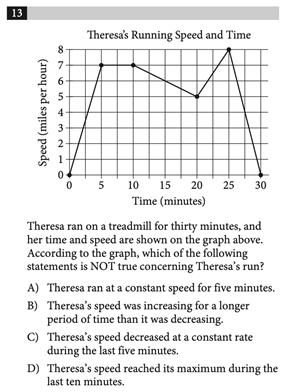
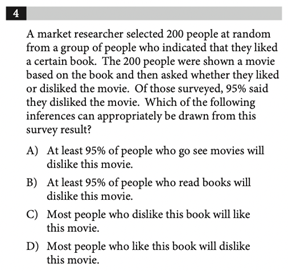
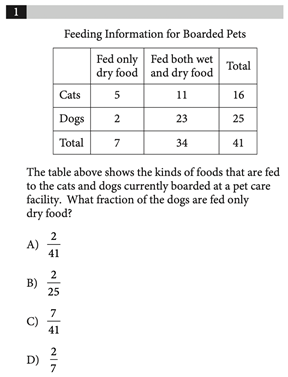
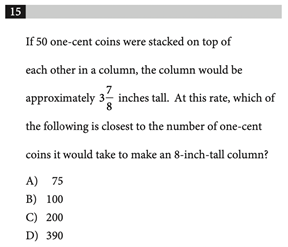
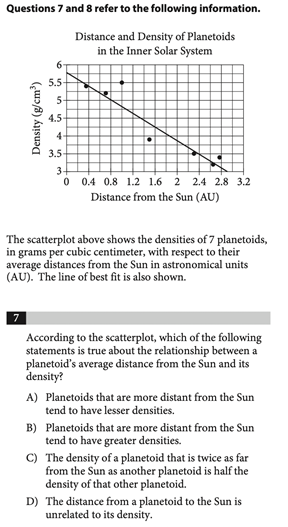
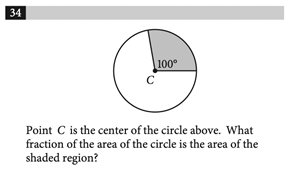
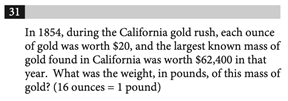
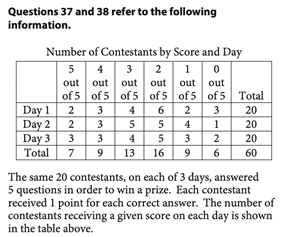
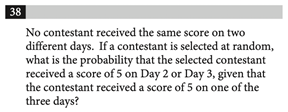
Problem Solving and Data Analysis questions appear on the Calculator section of the SAT Math test and involve applying mathematical knowledge to real-world contexts. These problems can be tough, so if you want to improve your math score, here are some strategies and practice problems to help you out. The SAT Math section contributes to half of the total SAT score. This section is scored out of 800 and includes three main categories, which each have a subscore out of 15. Here is the breakdown of each category: Additional Topics in Math covers the remaining 10% and consists of a variety of different mathematical topics. The Problem Solving and Data Analysis section tests students’ ability to solve real-world problems using mathematical understanding and skills. This includes quantitative reasoning, interpreting and synthesizing data, and creating representations. These questions never appear on the SAT No Calculator section, so you’ll always be allowed a calculator for them. Problem Solving and Data Analysis questions ask students to: Many selective colleges use a metric called the Academic Index (AI) to assess an application’s strength. The AI is calculated based on GPA and SAT/ACT scores, so you should make sure your scores are competitive to increase your chances of admission. Some colleges even automatically reject applicants with AIs that are too low. To see how your SAT score compares, use CollegeVine’s free Admissions Chances Calculator. This tool will let you know the impact of your SAT score on your chances and will even offer advice to improve other aspects of your profile. Problem Solving and Data Analysis problems often involve graphs or data tables, so it’s important to pay attention to titles and labels to make sure you don’t misinterpret the information. As you read the question, underline or circle any important numeric information. Also, pay close attention to what exactly the question is asking for. Because Problem Solving and Data Analysis problems vary, there is no concrete algorithm to approach them. These questions are typically more conceptual than calculation-based, so though a calculator is allowed, you probably won’t need it aside from simple arithmetic. Therefore, the key to these problems is reading carefully and knowing concepts like proportions, median, mean, percent increase, etc. Here are some sample difficult Problem Solving and Data Analysis questions and explanations of how to solve them. Remember, these questions only appear on the Calculator section of the exam, so you will have access to a calculator for all of them. Correct Answer: B This problem involves computing the median. If you have a graphing calculator, this could be done via lists, but since there are only 7 data values, it might be faster to just write this one out. The median is the measure of the middle of the data set, so start by ordering the values from smallest to largest. This results in the following list: 19.5%, 21.9%, 25.9%, 27.9%, 30.1%, 35.5%, 36.4%. From here, we can clearly see that the middle value is 27.9%, so that is our median. However, we’re not done here. We now have to compute the difference between the median we just calculated and the median for all 50 states, 26.95%. Subtracting these two values yields 0.95%, which corresponds to answer choice B. Correct Answer: B Percent increase can be a tricky concept if you don’t remember this rule of thumb: “new minus old over old.” In this case, for the percent increase from 2012 to 2013, we take the “new” value, 5,880, and subtract the “old” value, 5,600. This is 280, which we then divide by the “old” to get .05, which is 5%. Since the percent increase from 2012 to 2013 was 5%, and this is double the predicted increase from 2013 to 2014, we know that the percent increase from 2013 to 2014 will be half of 5%, or 2.5%. Then, to calculate the number of subscriptions sold in 2014, we multiply the value in 2013, 5,880, by 2.5%. This yields 147, which means that in 2014, 147 additional subscriptions were sold. So, the total amount of subscriptions sold in 2014 is 5,880 + 147 = 6,027. Correct Answer: B Since we are presented with a graph, let’s make note of what this graph is showing us. On the y-axis we have speed, and on the x-axis we have time. So, this graph is showing us how Theresa’s speed varies with time. When the graph is flat, the speed is unchanging and is therefore constant. When the graph has a positive slope, the speed is increasing, and when the graph has a negative slope, the speed is decreasing. The rates at which it increases and decreases will be constant since the graph is composed of straight lines (and a line has a constant slope, which means it changes at a constant rate). For questions asking which statement is not true, it’s crucial to take the time to read through each answer choice. First, choice A states that Theresa ran at a constant speed for five minutes. We can see that this is true, since from 5 to 10 minutes, the graph is flat. Next, choice C says that the speed decreased at a constant rate during the last five minutes. This is also true because from 25 to 30 minutes, the graph is a line with negative slope, which indicates decreasing speed. Finally, choice D claims the maximum speed occurs during the last 10 minutes. We can see that the maximum speed (the highest point on the graph) occurs at 25 minutes, which is within the last 10 minutes, so choice D is also true. By process of elimination, choice B should be correct, but let’s verify. Choice B states that Theresa’s speed was increasing for a longer time than it was decreasing. Speed was increasing from 0 to 5 and 20 to 25 minutes, for a total of 10 minutes. Speed was decreasing from 10 to 20 and 25 to 30 minutes, for a total of 15 minutes. So, the speed decreased for a longer time than it increased, and choice B is false, making it the correct answer. Correct Answer: D For questions involving surveys, always remember that generalizations can only be made to the specific population studied. For example, if a study is given to a select group of 5th grade math students, when analyzing the results, you can only generalize to 5th grade math students, not all math students or all 5th graders. In this case, the group surveyed was people who liked the book. From these people, 95% disliked the movie. So, from this survey, most people who like the book will then dislike the movie, which corresponds to choice D. Choices A and C are incorrect since they generalize to people who see movies and people who dislike the book, which doesn’t apply to the population studied. Choice B is incorrect since it falsely generalizes to all people who read books. Correct Answer: B Proportion problems are usually fairly quick, but easy to mess up on if not read carefully. For proportions, the denominator is the total number of things in the group we’re looking at, and the numerator is the specific characteristic we want. This question asks for the fraction of the dogs that are fed only dry food. So, the group we’re looking at is “dogs” and the characteristic we want is that they “are fed only dry food.” From the table, the total number of dogs is 25. This means the denominator will be 25. Next, we must find the number of dogs which are also only fed dry food, which is 2, according to the table. So, our numerator is 2, and the answer is 2/25. Correct Answer: B For this question, let’s start with what we know: the column is 8 inches tall. We know that 50 coins creates a \(3\frac{7}{8}\) inch column, which is approximately 4 inches. Since this question asks for an approximation, we know that 8 is slightly more than double \(3\frac{7}{8}\), so we’ll need slightly more than \(50\:\cdot\: 2\) pennies to create an 8-inch column. Answer B is the closest number to our approximate value. If you wanted to be precise, you could set up an equation: \(8 in\:\cdot\:\frac{50 coins}{3\frac{7}{8} in}\) Because 50 coins corresponds to a column which is \(3\frac{7}{8}\) inches tall, we set those two values up in a fraction. We decide which value goes in the numerator and which in the denominator based on the units: since we started with 8 inches, we need the \(3\frac{7}{8}\) inches to be in the denominator so that the inches cancel. Then, we are left with the unit in the numerator, which is coins. The question asks for the number of coins, so this is exactly what we want. At this point, you would use your calculator to solve the expression, and get about 103 coins. This value is closest to answer choice B. Correct Answer: A Once again, since we have a graph, let’s take a moment to read the labels. The y-axis shows density and the x-axis shows distance from the sun. We also see that the line of best fit is sloping downwards. As the distance increases, the density seems to decrease. So, choice A is correct in that larger distances correspond to lesser densities. Though it wasn’t explicit in this question, an important thing to note about scatterplots is that these relationships show correlation, not causation. Choice C is incorrect because it falsely implies that changes in distance cause changes in density. Choice D is incorrect since though there is no cause and effect relationship, there is a correlation between these two variables. Correct Answer: 5/18, .277, .278 This problem could be confusing in that so little information is given. However, this problem requires that you recall that the proportion of degrees is equivalent to the proportion of area. So, for this problem, all you have to do is divide 100 by 360, which is the total number of degrees in a circle. Then, the answer is 100/360, or 5/18. If you’re faced with a similar problem on the test, where there is little to no numeric information, try to work with the numbers you do have and find helpful relationships. Correct Answer: 195 Unit conversions are fairly simple once you set up the expression correctly. Start with the information given. For this problem, the price is $62,400, so we will start with this value. Next, we will multiply this value by fractions. Each fraction will consist of a numerator and denominator which are equivalent, so multiplying by these fractions is the same as multiplying by 1. Here is what the expression would look like: \(\$62,400\:\cdot\:\frac{1 ounce}{\$20}\:\cdot\:\frac{1 pound}{16 ounces}\) We decide which value to put in the denominator based on the units. In this case, the dollars and the ounces cancel, leaving us with pounds, which is what the question asked for. Solving this expression results in 195 pounds, the answer to the question. Correct Answer: 5/7, .714 Probability questions are similar to proportion questions in that the denominator should be the group we’re looking at and the numerator should be the characteristic we want. In this case, it is given that we’re looking at contestants who received a score of 5 on one of the three days, and there is a total of 7 such contestants. The characteristic we want is that the contestant received a score of 5 on Day 2 or Day 3. The number of contestants who fit this description is 2 + 3 = 5, so the probability is 5/7. For Problem Solving and Data Analysis problems, make sure that your answer addresses what the question asked for. Wrong answer choices on the SAT often reflect common student mistakes, so take the time to read Problem Solving and Data Analysis questions carefully. When studying for the SAT Math section, try to do plenty of practice problems. The best way to get better at math is to do more math. Here are some other articles that will help you prepare for the SAT Math section: What’s Covered:
Overview of SAT Math Problem Solving and Data Analysis
How Will the SAT Impact My College Chances?

Strategies to Solve Problem Solving and Data Analysis Problems
10 Difficult Problem Solving and Data Analysis Questions
1. Measures of Central Tendency (Mean/Median/Mode)
2. Percent Increase
3. Analyzing Graphical Data
4. Inference
5. Proportions

6. Scale Factors
7. Line of Best Fit/Scatterplots
8. Geometric Applications of Proportions
9. Unit Conversions
10. Probability
Final Tips and Strategies