How to Tackle the AP Statistics Free Response
What’s Covered:
- How Will AP Scores Impact My College Chances?
- Overview of the AP Statistics Exam
- AP Statistics Free Response Tips
- AP Statistics Free Response Practice Questions
Though many consider AP Statistics to be the “easy” AP math class (when compared to AP Calculus AB and BC), the exam is actually fairly rigorous, with only 16% of students receiving a 5 in 2021. The AP Statistics Exam challenges you to apply your statistics skills, and the Free Response portion is no exception. In this post, we’ll cover everything you need to know to do well on the AP Statistics Free Response.
How Will AP Scores Impact My College Chances?
AP Scores actually have virtually no impact on your college chances! Instead, admissions officers look at the classes themselves. Colleges want to see that you’re taking the most challenging courses offered at your school and that you’re doing well in them.
But, this doesn’t mean that you shouldn’t try on your AP exams – in some cases, your scores can help you receive college credit or placement in more advanced courses.
Overview of the AP Statistics Exam
The AP Statistics Exam consists of two parts, Multiple Choice and Free Response. The exam format is broken down as follows:
Section I: Multiple Choice, 50% of exam score
- 40 questions (90 minutes)
Section II: Free Response, 50% of exam score
- 6 questions (90 minutes)
The Free Response section itself consists of two parts:
Part A:
- 1 multipart question (collecting data)
- 1 multipart question (exploring data)
- 1 multipart question (probability and sampling distributions)
- 1 question (inference)
- 1 question (2 or more skill categories)
Part B:
- 1 investigative task (multiple skill categories and content areas)
You’re allowed a calculator on all sections of the exam.
AP Statistics Free Response Tips
1. Know your formula sheet
The AP Statistics Exam has an extensive, two-page long formula sheet. You don’t want to be seeing this formula sheet for the first time on test day. Make sure to familiarize yourself with it prior to taking the test. Try having the sheet printed out next to you as you take practice tests. This way, you’ll be comfortable with it and will know where to look to find the information you need – saving you precious time on test day!
2. Don’t leave anything blank
AP exams almost always award partial credit for free response sections, and the AP Statistics Exam is no exception. So, even if you’re unsure of how to complete a problem, write down some relevant information, and you may receive a few points.
Also, if your answer to part (b) of a question depends on your answer to part (a), but you were unable to complete part (a), just make up an answer! Then, use that made up answer in part (b). Even though you won’t receive credit for part (a), you still have a chance to receive full credit for part (b).
3. Label everything
Context is really important on the AP Statistics Exam. Make sure that all your answers have proper units and context. For example, if you’re stating a probability, make sure to include what it means.
Incorrect example: The probability is 54%.
Correct example: The probability is 54%. This means that there is a 54% chance that you will select a cat which weighs 9 pounds.
AP Statistics Free Response Practice Questions
All questions are official AP questions taken from past exams.
Question 1
Solution:
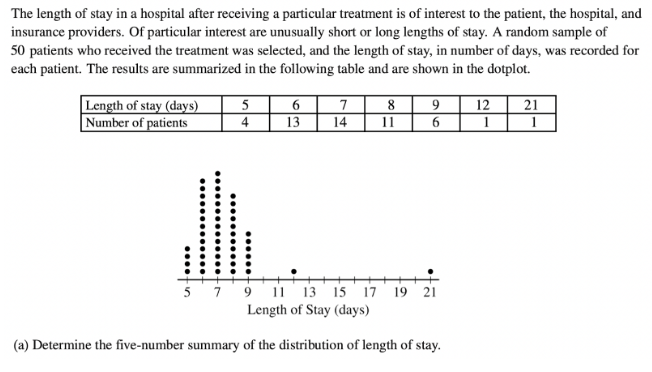
The five-number summary of a distribution includes the minimum, lower quartile, median. upper quartile, and maximum.
We can first easily identify the minimum and maximum, which are 5 and 12, respectively.
Next, let’s find the median. If there are 50 patients in total, the median will be in the \(\frac{(50 + 1)}{2}\) = 25.5th place. This means we’ll need to take the average of the 25th and 26th number, which are both 7. So, the median is 7.
Now, let’s find the lower quartile. The lower quartile is in the \(\frac{(25 + 1)}{2}\) = 12.5th place. So, it’s the average of the 12th and 13th number, which are both 6. Then, the lower quartile is 6.
Finally, we do a similar process to find the upper quartile. The upper quartile is in the 25 + 12.5 = 37.5th place. Then, the upper quartile is the average of the 37th and 38th number, which are both 8. So, the upper quartile is 8.
Then, we have the following five number summary:
Minimum: 5 days
Lower quartile: 6 days
Median: 7 days
Upper quartile: 8 days
Maximum: 21 days
Note how each number is following by “days,” since we need to provide context for our answers.
Question 2
Solution (from the official AP Exam Solutions):
“Keeping daily journals could introduce response bias due to the self-reporting by subjects who may have a poor or incomplete memory of the amount of walking that was done. If most subjects who keep daily journals underreport the number of miles walked per day because they cannot remember all of their walking at the end of the day, then the estimate of mean daily miles walked for the target population will be biased too low. Wearing activity trackers would likely provide a more accurate record of daily miles walked by each subject in the study.”
This solution would receive full credit because it correctly indicates the issue of underreporting. Alternatively, you could have identified that overreporting may be an issue as well. In either case, you’d need to state that these biases would affect the estimate for the population mean (by either over or underestimating).
Note how this response is thorough and clearly stated. Make sure to repeat the wording and language found in the question, as that is what the graders will be looking for when scoring your response.
Question 3
Solution:
First, let’s note that this is a binomial distribution, with n = 52 and p = \(\frac{1}{200}\)= 0.005. Next, we want the probability that an employee receives at least one gift card, or \(P(X \geq 1)\). The opposite of receiving at least one gift card is receiving no gift cards, so we get the following equation:
\(P(X \geq 1) = 1 – P(X=0)\).
Then, we can use the following given formula:
Then, P(X = 0) = \(\binom{52}{0} .005^0 (1-.005)^{52} = .7705\).
This means that \(P(X \geq 1) = 1 – .7705 = 0.2295\).
Question 4
Solution:
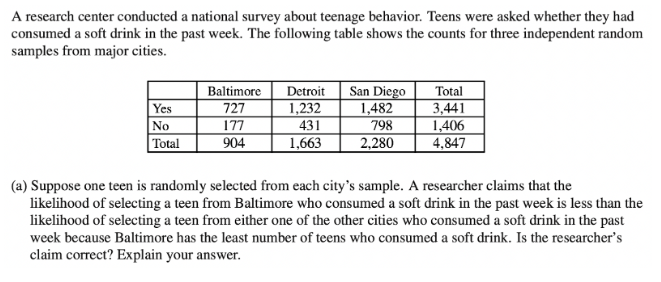
First, let’s determine the likelihood of selecting a Baltimore teen who consumed a soft drink in the past week:
The number of teens who consumed a soft drink in Baltimore is: 727.
The total number of teens in Baltimore is: 904.
Then, the likelihood is \(\frac{727}{904}\) = 0.804.
Next, let’s determine the likelihood of selecting a teen from either one of the other cities who consumed a soft drink in the past week (in this case, let’s choose Detroit):
The number of teens who consumed a soft drink in Detroit is: 1,231.
The total number of teens in Detroit is: 1,663.
Then, the likelihood is \(\frac{1231}{1663}\) = 0.741, which is less than the likelihood for Baltimore.
Thus, the researcher’s claim is incorrect.
Question 5
Solution:
For this question, we’ll need to conduct a one-sample z-test for a population proportion.
Let’s first check that the conditions for this test are met:
- Independence: This condition is met because the random sample is size 90 and it is likely that the large company has more than 90(10)=900 customers.
- Normal: We need to check whether np and n(1-p) are at least 10. We see that 90(.4)=36 and 90(.6)=54 are both greater than 10, so this condition is met.
Now, we can conduct the test.
Our sample proportion is: \(\hat{p} = \frac{38}{90}\) = .422.
Next, our test-statistic is: z = \(\frac{38}{90} – 0.4 \sqrt{\frac{(0.4)(0.6)}{90}}\) = 0.430.
Finally, our p-value is: P(z > 0.430) = 0.333.
So, since our p-value is larger than 0.05, we do not have sufficient evidence to reject our null hypothesis.
Additional Resources
Here are some additional articles which might help you as you prepare for the exam:
- The Ultimate Guide to the AP Statistics Exam
- 10 Hardest AP Statistics Practice Questions
- 2022 AP Exam Schedule


