The Ultimate Guide to the AP Statistics Exam
What’s Covered:
- What Does the AP Statistics Exam Cover?
- Sample AP Statistics Exam Questions
- AP Statistics Exam Score Distribution, Average Score, and Passing Rate
- Tips for Preparing for the Exam
- How Will Your AP Scores Affect Your College Chances?
The AP Statistics exam is an extremely popular AP exam. In 2022, over 215,000 students sat down to take the exam. Before that, these students spent months studying, practicing, and preparing, all in hopes of scoring high and, later, getting credit for their high scores.
Some students prepare for the AP Statistics exam by enrolling in a course at their high school, while others choose to self-study. In either case, acing the AP Statistics exam takes preparation. Whether you’re taking a course or intend to self-study, read on for a breakdown of the test and advice on how to best prepare for it.
What Does the AP Statistics Exam Cover?
The AP Statistics exam tests your mastery of the four basic themes of statistics—exploratory analysis, planning and conducting a study, probability, and statistical inference. The College Board provides a content breakdown that is helpful when deciding where to focus your energy during test prep. The exam is:
- 20-30% exploratory analysis
- 10-15% planning and conducting a study
- 20-30% probability
- 30-40% statistical inference
Mastery of ‘exploratory analysis’ includes:
- Constructing and interpreting graphical displays of distributions of univariate data (dot plot, stemplot, histogram, cumulative frequency plot)
- Summarizing distributions of univariate data
- Comparing distributions of univariate data (dot plots, back-to-back stemplots, parallel box plots)
- Exploring bivariate and categorical data
Mastery of ‘planning and conducting a study’ includes:
- Understanding various methods of data collection
- Planning and conducting surveys
- Planning and conducting experiments
- Understanding the generalizability of results and the types of conclusions that can be drawn from observational studies, experiments and surveys
Mastery of ‘probability’ includes:
- Combining independent random variables
- Understanding the normal distribution
- Understanding sampling distributions
Mastery of ‘statistical inference’ includes:
- Estimating (point estimators and confidence intervals)
- Being able to complete tests of significance
A full course description that can help guide your studying and understanding of the knowledge required for the exam can be found in the College Board AP Statistics Course and Exam Description document.
How Long Is the AP Statistics Exam? What Is the Format?
The AP Statistics exam is one of the longer AP exams, clocking in at three hours. It has two sections. The first section contains 40 multiple choice questions, spans one hour and 30 minutes, and accounts for 50% of your total score. The second section is the free response section, which lasts for one hour and 30 minutes and accounts for the remaining 50% of your score. This section is divided into five short-answer questions and one investigative task.
|
Section |
Skill Assessed |
Types of Question |
Number of Questions |
Scoring Weight |
|
Section I |
Multiple Choice |
Individual questions or sets of questions based on a shared prompt |
40 |
50% |
|
Section II |
Free Response |
Five short answer questions and one investigative task. See breakdown below. |
6 |
50% |
Free Response questions:
- 1 multipart question with a primary focus on collecting data
- 1 multipart question with a primary focus on exploring data
- 1 multipart question with a primary focus on probability and sampling distributions
- 1 question with a primary focus on inference
- 1 question that combines 2 or more skill categories
- 1 investigative task that assesses multiple skill categories and content areas, focusing on the application of skills and content in new contexts or in non-routine ways
Can I Use a Calculator?
You are expected to bring a scientific calculator with statistical capabilities and to use it on the exam. Your calculator’s graphing capabilities should include common univariate and bivariate displays such as histograms, box plots, and scatter plots. The calculator should also be able to complete statistical univariate and bivariate summaries through linear regression. You may bring up to two calculators to the exam. The complete calculator policy and a list of acceptable models can be found here.
Sample AP Statistics Exam Questions
Multiple Choice: Section I
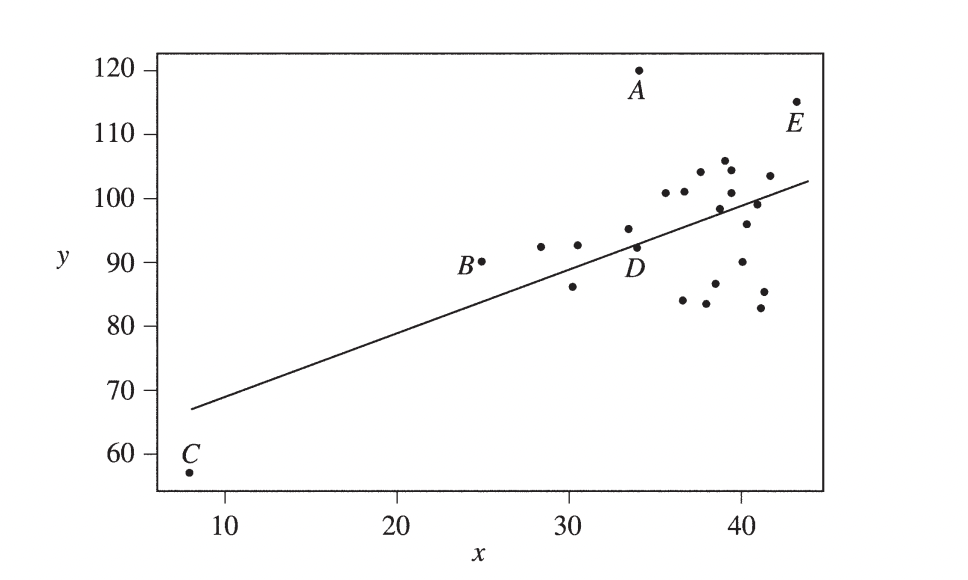
1. In the scatter plot of y versus x shown above, the least squares regression line is superimposed on the plot. Which of the following points has the largest residual?
(a) A
(b) B
(c) C
(d) D
(e) E
2. Under which of the following conditions is it preferable to use stratified random sampling rather than simple random sampling?
(a) The population can be divided into a large number of strata so that each stratum contains only a few individuals.
(b) The population can be divided into a small number of strata so that each stratum contains a large number of individuals.
(c) The population can be divided into strata so that the individuals in each stratum are as much alike as possible.
(d) The population can be divided into strata so that the individuals in each stratum are as different as possible.
(e) The population can be divided into strata of equal sizes so that each individual in the population still has the same chance of being selected.
3. All bags entering a research facility are screened. Ninety-seven percent of the bags that contain forbidden material trigger an alarm. Fifteen percent of the bags that do not contain forbidden material also trigger the alarm. If 1 out of every 1,000 bags entering the building contains forbidden material, what is the probability that a bag that triggers the alarm will actually contain forbidden material?
(a) 0.00097
(b) 0.00640
(c) 0.03000
(d) 0.14550
(e) 0.97000
Free Response: Section II
1. The summary statistics for the number of inches of rainfall in Los Angeles for 117 years, beginning in 1877, are shown below.
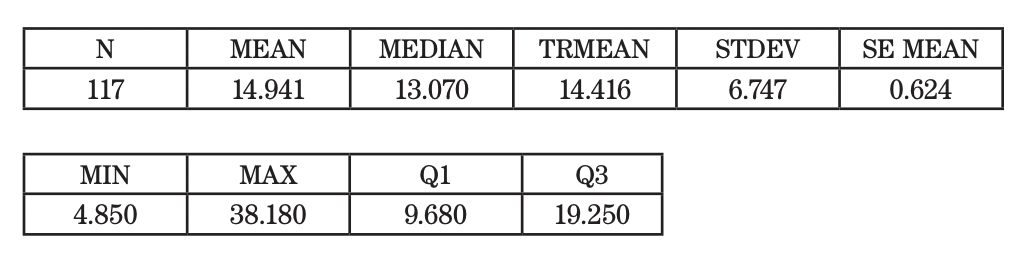
(a) Describe a procedure that uses these summary statistics to determine whether there are outliers.
(b) Are there outliers in these data? Justify your answer based on the procedure that you described in part (a).
(c) The news media reported that in a particular year, there were only 10 inches of rainfall. Use the information provided to comment on this reported statement.
2. A department supervisor is considering purchasing one of two comparable photocopy machines, A or B. Machine A costs $10,000 and machine B costs $10,500. This department replaces photocopy machines every three years. The repair contract for machine A costs $50 per month and covers an unlimited number of repairs. The repair contract for machine B costs $200 per repair. Based on past performance, the distribution of the number of repairs needed over any one-year period for machine B is shown below.
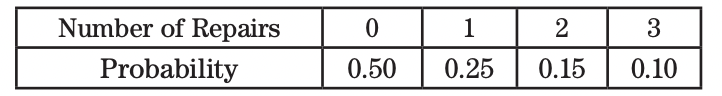
You are asked to give a recommendation based on overall cost as to which machine, A or B, along with its repair contract, should be purchased. What would your recommendation be? Give a statistical justification to support your recommendation.
AP Statistics Exam Score Distribution, Average Score, and Passing Rate
Historically, fewer students (by percentage) score a 5 on the AP Statistics exams than on other AP exams. In 2022, scores were distributed as follows:
- 14.8% of test-takers received a 5
- 22.2% of test-takers received a 4
- 23.4% of test-takers received a 3
- 16.5% of test-takers received a 2
- 23.1% of test-takers received a 1
This means that 60.4% of students who took the exam received a 3 or higher (typically considered passing).
Note: The credit you will receive for AP exam scores varies widely from school to school. For example, prestigious schools (and even prestigious programs at schools) might accept only a 4 or a 5 to receive course credit. Though a score of 3 is typically considered passing, it’s not always enough. You can use this search tool to see what scores will allow you to receive credit at a specific college or university.
Tips for Preparing for the Exam
Step 1: Assess Your Skills
A helpful way to begin your exam preparation process is by taking a formative assessment. A formative assessment allows you to see your initial areas of strength and areas needing improvement. It’s important to see where you are, so that you know how far you need to go!
There are a few ways to take a formative assessment:
- Print a previous exam online and self-proctor
- Use a diagnostic test offered through a commercial study guide
- Ask your teacher to proctor an exam during office hours after school or over a few lunch periods
The 2012 exam has been openly published by the College Board and might be a good place to start. The College Board also has free response questions from the last few decades published online, though you should note that these are not complete assessments.
Step 2: Study the Material
As outlined in our “What Does the AP Statistics Exam Cover?” section, the AP Statistics exam tests very specific skills and subskills. Consequently, as you identify the correct and incorrect responses on your diagnostic exam, you’ll be able to identify very specific gaps in your knowledge, which you can then consider your areas needing improvement.
Some of these gaps may be content related—you don’t understand the Chi-square test or you struggle with confidence intervals. On the other hand, your areas of improvement might be form related—you get lost in the wordiness of free response questions or struggle with visualizing box plots.
Write down your areas that need improvement, then home in on one area during each study session. Watch videos about particular concepts, read sections in books about them, and talk to your classmates about them. Then, do that again and again and again with different concepts until the areas you struggle with become areas you excel in.
Some students use commercial study guides when studying. This can be beneficial, depending on your learning style. That said, if you choose to use a commercial study guide, be smart about it. Take advantage of the fact that the sections and subsections in study books focus on specific concepts. Don’t get stuck reading a guide front to back and don’t waste time on content that you have already mastered!
Lastly, look into the free resources that are available online! For decades, AP teachers have been publicly posting complete study guides, review sheets, and test questions. Use these for your benefit.
Step 3: Practice Multiple Choice Questions
Once you’ve mastered the concepts you initially struggled with, put them into action by answering some multiple choice practice questions.
The College Board course description includes many practice multiple choice questions along with explanations of their answers. As you go through these, keep track of the areas that are still causing you trouble, and go back over those concepts again. Focus on understanding what each question is asking and keep a running list of any vocabulary that is still unfamiliar to you.
Step 4: Practice Free Response Questions
Some things to pay attention to when preparing for the free response questions include:
- Making sure you are spending the right amount of time on each question
- Making sure you answer questions in a way that gets you points from the rubric
The College Board has structured the free response section in such a way that you’re expected to answer each question in approximately 12 minutes. The final question—the investigative task—is intended to take you 30 minutes. These are recommendations for timing that will not be vocalized by the proctor, so it’s important to practice getting the right answer to the free response questions in an appropriate amount of time.
As you do individual free response questions, monitor your timing and pay attention to what is eating away at your time.
Additionally, free response questions are graded on rubrics, which typically emphasize a student’s ability to organize and present findings. This means that, while it does matter whether you arrive at the “correct” answer, it also matters how you got there and how well you were able to communicate your choices and methods. Because of this, you should not only practice answering free response questions, but should ask others to grade your responses, adhering strictly to a rubric, to ensure that you are truly communicating your mastery.
Pro tip: When completing the free responses, organize your work as clearly and neatly as possible. If the person scoring the exam cannot easily follow your reasoning, you will not receive credit for your response. Also, if you are unsure of a specific equation, make your best guess and explain why you did so. Don’t write multiple equations, hoping that the correct one will be among them—you can lose points for the extraneous or incorrect information.
Step 5: Take Another Practice Test
When you start feeling more confident or just want to see your progress, sit down and take another complete practice test. This will help you see where you have improved and where you should continue to focus your energy. It will serve as a progress report of sorts.
Step 6: Exam Day Specifics
In 2023, the AP Statistics Exam will be administered on Thursday, May 4 at 12 PM local time.
For complete registration instructions, check out CollegeVine’s guide: How to Register for AP Exams (Even If You Didn’t Take the Class).
For information about what to bring to the exam, see CollegeVine’s post: What Should I Bring to My AP Exam (And What Should I Definitely Leave at Home)?
How Will Your AP Scores Affect Your College Chances?
While AP scores are not required when applying for college, they can be a way for high-performing students to set themselves apart, particularly when applying to prestigious universities. Through the process of self-reporting scores, you can show your hard work and intelligence to admissions counselors.
That said, the main benefit of scoring high on AP exams comes once you land at your dream school, as high scores can allow you to “test out” of entry-level requirements, often called GE requirements or distribution requirements. This will save you time and money.
If you’re starting to think about what schools you should apply to, we recommend that you use CollegeVine’s free chancing engine. This tool will consider your test scores, GPA, extracurriculars, and more, to calculate your chances of acceptance at various schools and help you decide where to apply.
Once you know which schools you are applying to, you can use the College Board’s search tool to see what score you should strive for on the AP Statistics exam.