10 Hardest AP Statistics Practice Questions
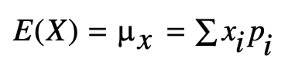
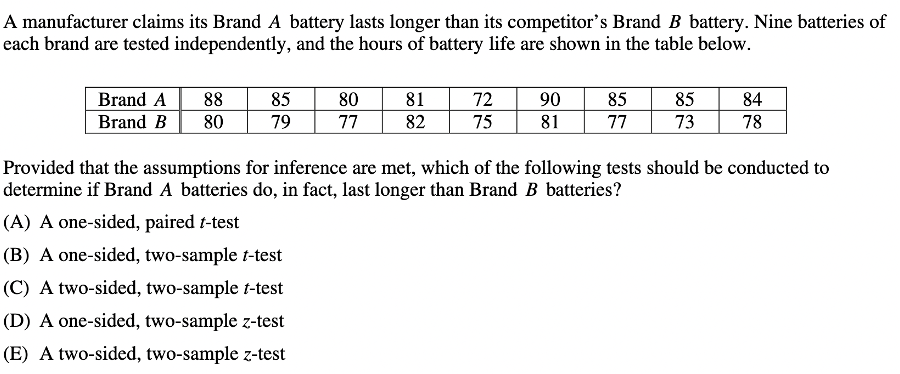
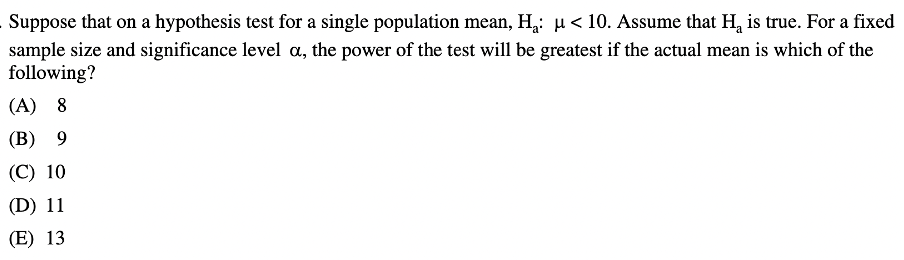
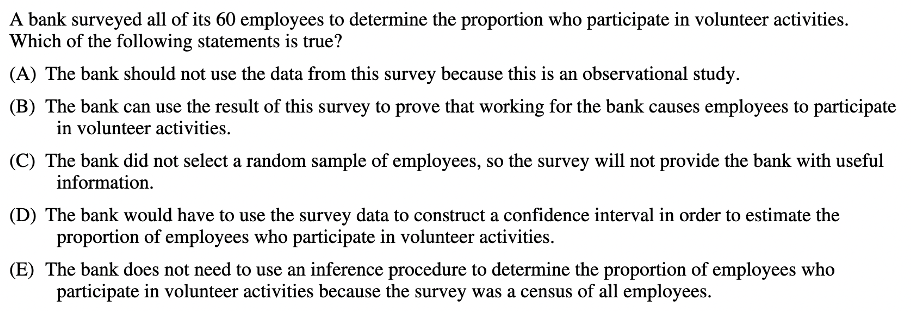
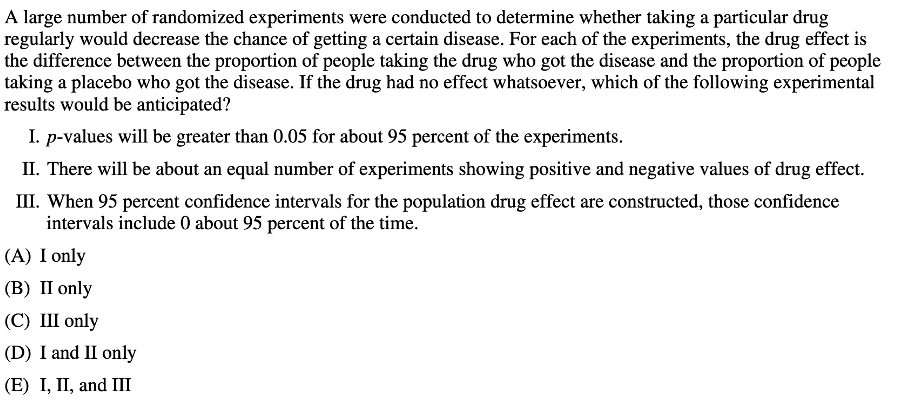
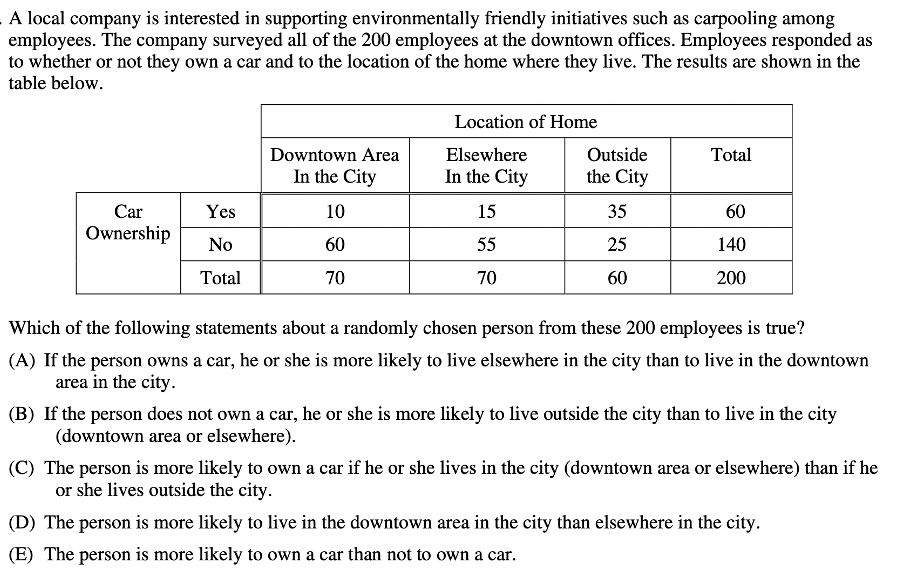
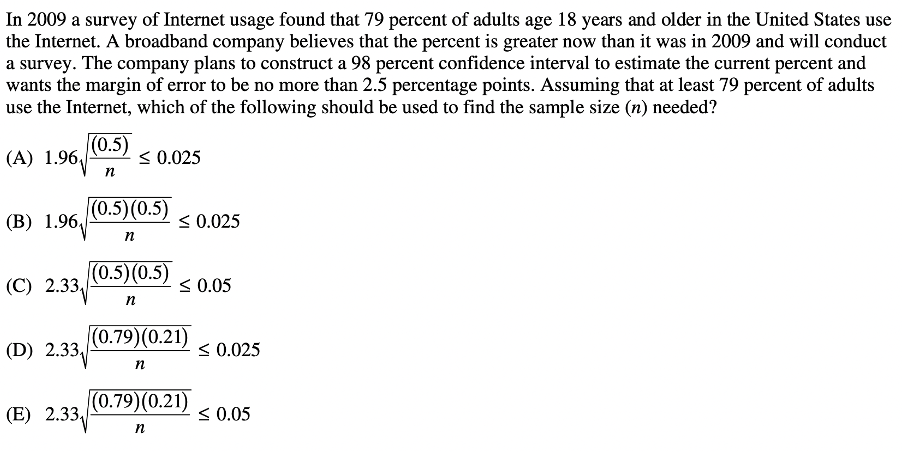
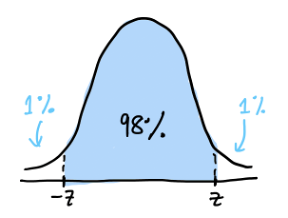
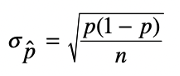
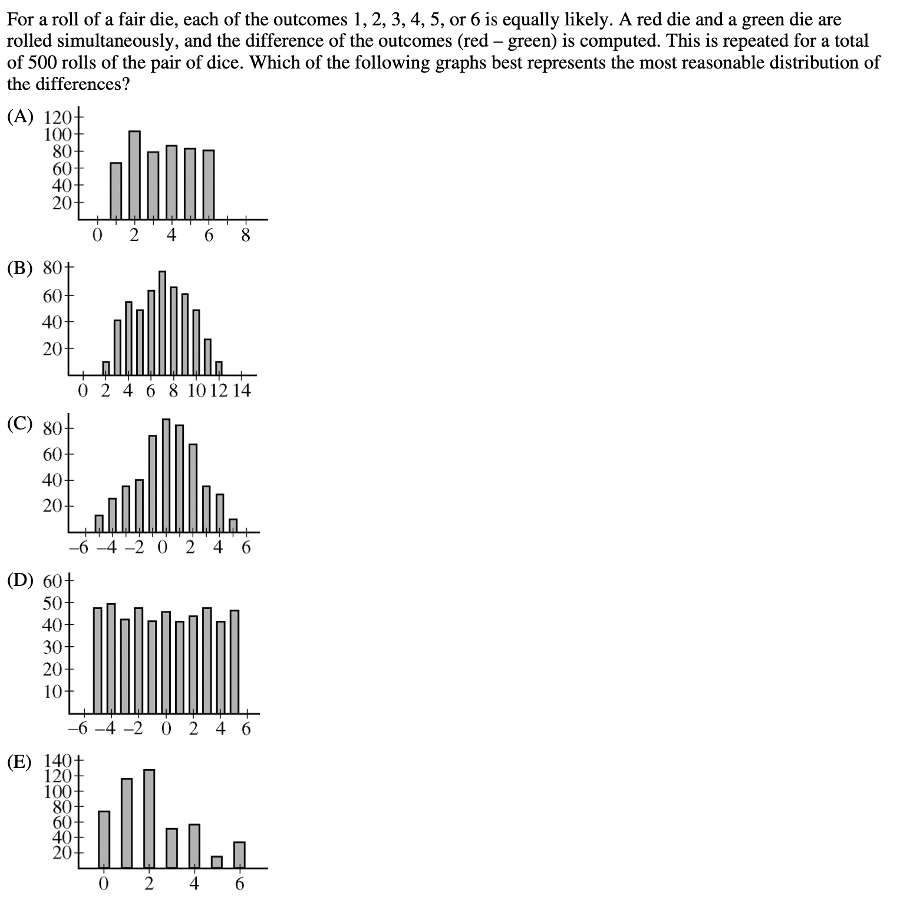
Whether you’ve taken an AP exam or not, you’ve likely heard about their notorious rigor and difficulty. After all, these exams are meant to evaluate whether you have a college-level grasp of the material. AP Statistics is one of the harder AP exams; in 2020, the AP Statistics Exam had a pass rate of 60%, with 16.2% of test-takers receiving a score of 5. Keep reading to learn more about the AP Statistics exam and see some harder problems—with detailed explanations! AP scores alone generally don’t impact your college chances much. In fact, most colleges don’t require you to report your score, though self-reporting is optional. Taking AP classes in general, however, is beneficial to your college chances since they’re important in demonstrating to colleges your aptitude in a particular subject. To learn how your course rigor impacts your chances, we recommend using our free Admissions Chances calculator, which will let you know your odds of getting into hundreds of schools! But, this doesn’t mean your scores aren’t important–some colleges will waive course requirements if your score is high enough. Though the requirements vary from school to school, it’s generally in your best interest to aim for a high score on your AP exams. Read more about the effect of AP Scores on your college chances. For the 2021 testing year, CollegeBoard is offering three different administrations of the AP Statistics exam. The first two administrations will be the traditional paper format, and the third administration will be digital. The paper administration is held on May 17, 2021 and consists of two sections: The digital administration is held on May 25, 2021 and consists of two sections: Regardless of which administration you take, the exam will test your knowledge of the following skill categories: You’ll also need a graphing calculator to take the exam, so make sure you’re comfortable using a graphing calculator to solve statistics problems. Here are some sample AP Statistics questions which are on the tougher side. Answer: C Since this question deals with expected value, we’ll need the following given formula: In this formula, \(E(x)\) (or \(\mu_x\)) represents the expected value, and it’s equal to the sum of each event \((x_i)\) multiplied by the probability of that event \((p_i)\). With expected value problems, it’s usually best to construct a table. First, recall that we want it to be advantageous to guess. This means the expected value of guessing should be higher than 2 (since leaving the question blank results in a score of 2). So, if we are left with \(n\) answer choices, we can construct the following table: Correct response Incorrect response x 7 0 p \(\frac{1}{n}\) \(1-\frac{1}{n}\) For a correct response, the x-value is 7 (since a score of 7 is given for each correct answer), and the probability is \(\frac{1}{n}\) (if there are \(n\) answer choices, you have a 1 in \(n\) chance of guessing the correct answer). Similarly, for an incorrect response, the x-value is 0, and the probability is \(1-\frac{1}{n}\) (since you can either get a question correct or incorrect). So, \(E(x)=7(1/n)+0(1-1/n)\gt 2\) This simplifies to: \(7/n\gt 2\), which means that \(n\lt 3.5\). So, we would need 3 answer choices left for it to be advantageous to guess. But, this question is tricky since it asks for the number of answer choices that should be eliminated, not left. Thus, we have \(5-3=2\), and the correct answer is C. Answer: D Based on the information given, we can start by stating that \(P(A)=0.01, P(B)=0.03,\) and \(P(C)=0.04.\) Since any one component failing will cause the device to fail, the probability of the device failing is \(P(A) \bigcup P(B) \bigcup P(C)\). So, the probability that the device will not fail is \(1-P(A) \bigcup P(B) \bigcup P(C)\). The AP Statistics Exam gives the following formula for calculating the union between two events: So, in our case we have that: \(P(A) \bigcup P(B) \bigcup P(C)=P(A)+P(B)+P(C)-P(A\bigcap B\bigcap C)\). To find \(P(A\bigcap B\bigcap C)\), note that the problem stated that “the components fail independently of one another.” This means that \(P(A\bigcap B\bigcap C)=P(A)*P(B)*P(C)\). Then, \(P(A) \bigcup P(B) \bigcup P(C)=P(A)+P(B)+P(C)-P(A)*P(B)*P(C).\) So, if we substitute the corresponding values, we get: \(P(A) \bigcup P(B) \bigcup P(C)=0.01+0.03+0.04-(0.01*0.03*0.04)=0.79988.\) This means our answer should be \(1-0.79988\approx 0.922\), which corresponds to answer choice D. Answer: D You should definitely expect to be tested on inference, random sampling and random assignment on the AP Statistics exam. The general rule of thumb is: If you have random sampling, you can generalize to the population. If you have random assignment, you can conclude cause and effect. For this question, it’s asking if we can assume that “the difference in sales was caused by the different cover designs.” So, we’re essentially being asked if we can draw conclusions about cause and effect. This means we need to check if the experiment had random assignment. When describing the experiment, the question states that “thirty-five of these stores were randomly assigned,” so we do have random assignment! This means the correct answer is D, since random assignment allows us to draw an inference about the difference in sales being caused by cover design. Answer: B The AP Statistics Exam expects you to not only conduct different tests, but also understand when to use each type of test. With this question, we can start by eliminating D and E; since we are not given information about either population’s standard deviation, we will have to conduct a t-test instead of a z-test. Next, since we’re determining whether Brand A batteries last longer than Brand B batteries, our test should be one-sided. Had the question asked if there was a difference between the two brands, we would then use a two-sided test, since we’d want to know if Brand A lasts longer or shorter than Brand B. So, we can also eliminate answer choice C. Finally, we need to determine if a paired or two-sample test would be more appropriate. Because the question told us that the batteries were tested independently, it’s better to use a two-sample test. Thus, the best answer choice is B. [amp-cta id="9459"] Answer: A The power of a test is the probability of correctly rejecting the null hypothesis when it is false. This question gives us the alternative hypothesis (\(H_{a}: \mu \lt 10\)), so if we reject the null hypothesis, this alternate hypothesis should be true. Because answer choices C, D, and E all render the alternative hypothesis false (since the actual means would be greater than 10), they’re incorrect. Answer choice A is correct because it would result in a greater power than B, since 8 is even farther from 10 than 9 is. Answer: E Along with the different types of tests, the AP Statistics Exam expects you to know the different sampling and survey methods. In this case, the bank is surveying all of its employees, so we have a census. For these questions, answering by elimination is a useful strategy. Choice A is incorrect because though observational studies cannot determine cause and effect relationships, they can still give important correlative data. Choice B is incorrect since it contains the word “causes” (again, observational studies cannot prove cause and effect). Choice C is incorrect since, though there wasn’t a random sample, this does not mean no useful information can be gained. In fact, since the whole population was surveyed, there is a lot of useful information that can be gathered because no generalizations have to be made. Finally, choice D is incorrect since the entire population was surveyed, so there is no need to estimate the proportion of employees who participate in volunteer activities–the survey results will give an accurate proportion. This same reasoning is why answer choice E is correct. Answer: E Multiple-select questions such as these are notoriously difficult. However, if we consider each statement separately, we should be able to determine the correct answer fairly easily. The first statement should be true. If the experiment finds that the drug had no effect, that means we cannot reject the null hypothesis. This occurs when the p-value is greater than 0.05. The second statement is also true. If there was an unequal number of experiments positive and negative values of drug effect, the data would indicate that the drug did have an effect (since the number of positive values would outweigh the number of negative values, or vice versa). Finally, the third statement is correct. If 0 is included in a confidence interval, this is equivalent to saying that no change has occurred (because the drug effect could be 0). Since all three statements are true, the answer is E. Answer: A For this question, we’ll need to pay close attention to the labels on the table. The answer is choice A since it says that owning a car makes you more likely to live elsewhere than downtown. Let’s analyze the data: Proportion of individuals who own a car that live in the downtown area: 10/60 Proportion of individuals who own a car that live elsewhere in the city: 15/60 The reason both fractions are out of 60 is that we are only looking at people who own a car (and there are 60 such employees). So, since 15/60 > 10/60, people who own cars are more likely to live elsewhere than downtown. B is not correct because the proportion of people who don’t own a car and live outside the city (25/140) is greater than the proportion of people who don’t own a car and live in the city (115/140). C is not correct because of the 60 people who own a car, more live outside the city (35) than in the city (25). D is not correct because there is an equal number of people living in the downtown area of the city vs. elsewhere in the city. E is incorrect because more people do not own a car (140) than those who do (60). Answer: D For this question, we’ll need to use the following given formula: The margin of error is the part that includes the critical value multiplied by the standard deviation of the statistic. To find the critical value, note that we have a 98% confidence interval. This means that the middle area is 98%, and thus the area to the left is 1%. The following diagram illustrates this: So, to find the z-value, we can use the InvNorm function on the calculator, with an input of 0.01 (referring to the 1% on each side), to get that \(z=2.33\). Next, since we know the population proportion (79% of adults in the US use the internet), we can use the following formula to find the standard deviation of the statistic: In this formula, \(\sigma _{\hat{p}}\) represents the standard deviation of the statistic, \(p\) represents the proportion of the population (adults in the US) who use the internet, and \(n\) represents the sample size, which we are trying to find. Since \(p=0.79\), our standard deviation is \(\sqrt{\frac{.79(1-.79)}{n}}\). Then, the correct answer is either D or E. But, we were given that the margin of error should be less than 2.5%, so answer D is the correct choice. Answer: C You might be tempted to analyze the possible outcomes to determine the most reasonable distribution and answer the question. While this method will certainly get you the right answer, a more simplified approach involves the process of elimination. To start off, we can easily eliminate answer choices A, B, and E. This is because the difference between the red and green die can be a negative value. Next, when choosing between C and D, note that with C, the middle values are more likely, and with D, all values are equally likely. But, let’s consider the outcomes 0 and 5. For the outcome to be 0, we would need to have red – green be 0. This is possible when the red and green die show the same value, so we could have the following combinations: Red: 1, Green: 1 Red: 2, Green: 2 Red: 3, Green: 3 Red: 4, Green: 4 Red: 5, Green: 5 Red: 6, Green: 6 For the outcome to be 5, we would need to have red – green be 5. This is only possible when we have that: Red: 6, Green: 1 So, we can clearly see that getting a result of 0 is much more likely than a result of 5, and C is the correct answer choice. Here are some final tips to guide you as you’re studying for the AP Statistics Exam: As you complete practice problems and practice exams, make sure to practice using your calculator! In most cases, a calculator will simplify a problem or make it much quicker to answer. So, ensuring that you’re comfortable using your calculator will ease the test-taking process. Because both the multiple-choice and free-response portions of the AP Statistics Exam depend more heavily on a calculator than other AP exams, you’ll want to brush up on your calculator skills prior to taking the test. Though this is a useful tip for any exam, it’s especially important for the AP Statistics test. Remember, these problems are designed to trick you, and there are often major details hidden in the fine print. Practice active reading by underling, circling, or boxing key terms, numbers or other information. Also, reading carefully is especially important with graphics. Pay close attention to the labels on any charts, plots, or tables, as these will be key in determining the correct answer. Finally, here are some additional resources that might be helpful as you prepare for this exam: What’s Covered:
How Will AP Scores Impact My College Chances?

Overview of the AP Statistics Exam
10 Hardest AP Statistics Questions
Question 1
Question 2
Question 3
Question 4

Question 5
Question 6
Question 7
Question 8
Question 9
![]()
Question 10
Final Tips
1. Use your calculator
2. Read carefully