Complete Guide to Your ACT Score Report
There’s no doubt that the ACT and the SAT are among the most important tests that a high school student takes. As such, it’s imperative that you know how to interpret your scores and glean from them as much information as possible. The new ACT score reports, most recently modified in September 2016, contain many valuable insights into your performance. By interpreting your results, you can find where to direct your studying for future tests, which academic areas might need reinforcement in school, and even how closely your interests align with your potential college major. In this post, we will provide an overview of how your ACT is scored, when and how to access your results, and what your detailed score report actually means. We’ll also answer a few potential questions you might have about sending reports or verifying their validity. For more information about ACT results and how you can use them to your advantage, read on. While there is no minimum ACT test score required for college admissions, each school has an ideal ACT score range in which they hope applicants will score. Every school has a different approach to weighting standardized test scores. As a general rule, though, it’s good to fall somewhere in the middle 50% of last year’s accepted students’ score range. The higher you fall in the range (or even beyond it), the better. The middle 50% is a range almost every college posts somewhere on their admissions page. They plot the scores of all accepted students who took the ACT results for a given class year. If they published all scores, the range would include all kinds of exceptional candidates and not be very useful. So instead, they cut off the 25% highest and lowest scores, publishing the middle 50%. For example, here are the score ranges from the Top 20 Rated Universities and Top 20 Rated Colleges: For a good ACT score goal, you should look up the middle 50% ACT score range for schools you hope to attend. If it’s a dream school, aim to fall anywhere in the range. For target schools, shoot for the upper bound of the range. For safety schools, try to earn a score beyond the middle 50% score range. Of course, in all situations, the higher the score, the better. To get an even better idea of where your score places you, read CollegeVine’s What Is a Good ACT Score? Simply put, your score for each section is calculated by a computer that scans the number of answers you got correct and produces your raw score. Your raw score for each section is then converted into a scaled score, ranging between 1-36, which takes into account very slight differences in difficulty on different forms of the ACT. Basically, it ensures that a specific score indicates the exact same level of mastery across every version of the test. Next, your scaled scores from 1-36 for each of the four required sections (English, Math, Reading, and Science) are averaged together to create a composite score indicating your overall performance. Your composite score is rounded to the nearest whole number, with decimals less than .5 being rounded down and decimals equal to or greater than .5 being rounded up. This means that you can in fact get a perfect composite score without getting perfect section scores; for example, if you were to score a 36, 34, 36, 36 on each of the sections, your average would be 35.5, which rounds up to 36. If you take the optional Writing test, your overall score is reported on a range from 2-12. This score is the average of four domain scores also ranging from 2-12. These domain areas are: Ideas and Analysis, Development and Support, Organization, and Language Use and Conventions. Two trained readers will give you a score from 1-6 in each of the domains. If their scores vary by more than one point, another reader will resolve the discrepancy. Your score for each domain is the total of both readers’ points. The Writing test score is not factored into your composite score, but will be on your score report. To learn more about the ACT scoring process, check out CollegeVine’s post How Does the Scoring Curve Work for the ACT?. The exact timeframe for returning score reports varies. Generally, scores will become available sometime between ten days and six weeks after the test. If you took the exam with Writing, your ACT Writing Score is usually available about two weeks after the rest of your scores. For a complete calendar of score release date ranges, see the ACT Score Release Date Calendar. You can access your Student Report through your online ACT web account. This is the same account that you can use to register for tests online and to access the practice ACT Question of the Day. Your Student Report will include your ACT results along with college and career planning information. Your High School Report will be delivered to your high school about two to eight weeks after the test date. This will include all of the same information as your Student Report. Let’s break down the score report. When you first open it up, you’ll find a page that looks like this one, taken from the ACT’s Interactive Student Report: That’s an awful lot of writing and numbers to take in all at once, so let’s look at it piece by piece. The newest benchmark is the STEM Benchmark. It was introduced in late 2015 to provide additional insight on STEM-specific skills assessed through the Math and Science ACT tests. There is currently no benchmark for ELA or the Writing test. The STEM Benchmark, at 26, is the highest of all ACT Readiness Benchmarks. This is indicative of the difficulty of the first math and science courses taken by students enrolled as STEM majors as compared to those taken by most other college students. STEM majors can be expected to dive right into college calculus, chemistry, biology, physics, and engineering courses and an ACT STEM score of 26 or higher is associated with a 50% chance of earning a B or higher and about a 75% chance of earning a C or higher in these entry-level STEM courses. The Math Section of the ACT has 60 questions on it and takes 60 minutes. To make scoring for the four main sections similar, your raw score is scaled to a 36-point scale, with 1 being the lowest possible score and 36 being the highest score possible. In the example score report the ACT provides, the student received a scaled Math score of 19: You will also notice a purple line with a 22 written in it. That’s the ACT College Readiness Benchmark. For each subject, the ACT publishes a score that they recommend if students are to succeed in a college environment. The ACT College Readiness Benchmarks are standards of performance intended to predict a 50% chance of obtaining a B or higher or about a 75% chance of obtaining a C or higher in corresponding first-year college courses. In the example, the student falls a little bit below the benchmark. This is a good indicator that the student should keep studying to get a higher score. In general, you want all of your score to fall above the ACT College Readiness Benchmarks. Scroll down to “ACT Score Percentiles, or State and National Rankings” to see how the student performed relative to other test-takers. The ACT Science Section contains 40 questions and takes 35 minutes. It too is scaled to a 36-point scale, with 1 being the lowest possible and 36 being the top score. In the sample score report, the student has received an 18. The green shaded region above and below their score line indicates their score range, since the ACT recognizes that a student may be feeling better or worse on any given test day. The college readiness benchmark for the Science section is 23. If this student is hoping to study Biology, Chemistry, Earth Sciences, Physics, or Astrophysics, then it is a good idea to retest to prove proficiency. Scoring below the benchmark indicates that this student has more high school concepts left to master. You may remember from the test layout that the ACT has no STEM Section. Instead, the Math and Science scores are averaged to reveal your STEM subscore. In the example, the Math score is 19 and the Science score is 18. You would expect the STEM score to be 18.5, but since only whole numbers are allowed, it rounds up to 19. You can jump to the “ACT Score Percentiles, or State and National Rankings” section of this post to see how the student performed relative to other test-takers. You may notice that the STEM college readiness benchmark is higher than both the Math and Science benchmarks. That is the ACT’s way of letting you know that it helps to excel in at least one of these two sections if you plan on pursuing a STEM career. The English Section is 45 minutes long, with 75 questions in total. The student in the example earned a 24 out of 36 possible points. This student is well above the benchmark, suggesting that they have an aptitude for English. (You can ignore the blue icon, or visit the interactive student report to learn more about the shaded score range.) Your Reading Section score is based on how you answered 40 Reading questions in the 35 minutes allotted by the ACT. This student earned 23 of the 36 possible points on this section. That puts their score above the purple line for the college readiness benchmark. If you jump down to the “ACT Score Percentiles, or State and National Rankings” section of this post, you will see that this student performed better than most test-takers for this subject. However, an admissions committee would not say that this student excelled in Reading because part of their score range falls below the benchmark. To establish Reading as a strength, this student should score well above the college readiness benchmark. ELA stands for English Language Arts and refers to your performance on the English and Reading Sections combined. It is also scored out of a possible 36, and its college readiness benchmark is 20. If you want to distinguish yourself as an accomplished lover of the humanities, aim to earn at least a 23 on this section, as that will place your score range well above the benchmark. How you did on the 40-minute, optional writing prompt determines your ACT Writing Score. Unlike the other section, the ACT Writing Score is given on a scale of 2–12 points. Two graders read your essay and give it a grade of 1–6, with 6 being the highest score. The two scores are then added together to give the cumulative ACT Writing Score. Unlike the other sections of the ACT, the Writing section has no college readiness benchmark. Now that you understand each section on its own, you can put your Composite Score in context. Your Composite Score is the average of your scores on the four main sections of the test: Math, Science, English, and Reading. In this example, the composite score is 21 out of a possible 36. Underneath your composite and section scores, you’ll see your ACT score percentiles, written as both national and state rankings: Image courtesy of ACT These graphs show how your scores compare to those of other test-takers. The bar graph under the US Rank heading on the left shows your ACT score compared to students nationally. Percentiles are an important metric, as they give you perspective about how your performance stacks up. If your composite score fell in the 56th percentile, as in the example above, that would mean that for every 100 test-takers in the nation, you scored higher than 56 of them. Basically, you scored higher than 56% of other ACT students. For the state ranking, it appears that this student scored in the 58th ACT score percentile of all test-takers in their state. In this comparison, the student is only being compared to other test-takers in their state, not nationally. Additionally, there are percentiles for each of the sections the ACT administers, as well as two additional score percentiles for STEM and ELA as umbrella categories. We can see from the graphic that this student is stronger in English Language Arts than Science, Technology, Mathematics, and Engineering because all of their blue ACT score percentiles are higher than their green ones. The section following your national and state rankings will show your detailed results. This section has information on your performance within each subject area on more precise skill and content area questions. You can find an example of this section below: Note that the categories under each section test show subsections of knowledge that are assessed during the test. While questions are not grouped or labeled by their category on the test, each question is categorized by the ACT to fall into one of the subscore categories under each section. On the Math test, questions fall into the following categories: Preparing for Higher Math, Integrating Essential Skills, and Modeling. The Preparing for Higher Math questions can be further divided into Number & Quantity, Algebra, Functions, Geometry, and Statistics & Probability questions. On the Science test, questions can be broken down into Interpretation of Data, Scientific Investigation, and Evaluation of Models, Inferences, & Experimental Results. On the English test, questions can be broken down into Production of Writing, Knowledge of Language, and Conventions of Standard English. Finally, on the Reading test, questions can be broken down into Key Ideas & Details, Craft & Structure, and Integration of Knowledge & Ideas. While your percentage of correct questions in each subcategory bears little to no weight on college admissions decisions, it is a great indicator to you of your performance in more specific content areas on the ACT. If you plan to take the test more than once, these subscores should help to shape your studying by highlighting areas in need of further reinforcement. Next to each of these subscores, you will see your performance as a percentage of questions correct, with the same percentage shown visually on a bar graph. This bar graph will also include a purple bar indicating the ACT Readiness Range. If your performance in each category meets the readiness benchmark, you will see a checkmark to the right of the bar graph. Although there are a few more sections of your score report, the last one that we’re going to discuss in any depth is the College and Career Planning section. The remainder of the score report descriptions are fairly self explanatory or simply outline ACT policies. The College and Career Planning portion of your score report will look something like this: Before you began the ACT, you took an interest inventory that asked questions about the things you enjoy doing or are interested in learning. You were also invited to indicate your intended college major if you had one. On this section of your score report, your interest inventory has been categorized to indicate a general idea of what you like to work with (data, things, ideas or people) and these interests have been used to create a short list of example occupations involving that kind of work. You will also see an indication of how closely your interests seem to mesh with the major you intend to enter. While for many, high school is quite early to know exactly what career path suits you best, you might be able to use some of this information to help shape your college course selection. For example, if your intended major and your interests don’t seem to align, you might use this information to experiment with classes more attuned to your interests, and see if you think they might provide an alternate career path. Don’t worry about this section too much, though. It is offered purely for your own reference, and while it is summarized on the score reports that colleges receive, it will not generally receive much attention from admissions committees. The College and Career Planning section can provide you with some of the earliest insight you’ve probably received about the alignment of your interests with potential career and academic paths. By understanding your ACT score report, you make the most of the information it provides. To learn more about the ACT test, check out these CollegeVine posts:
Want to know how your SAT score/ACT score impacts your chances of acceptance to your dream schools? Our free Chancing Engine will not only help you predict your odds, but also let you know how you stack up against other applicants, and which aspects of your profile to improve. Sign up for your free CollegeVine account today to gain access to our Chancing Engine and get a jumpstart on your college strategy!
What Score Do I Need to Get Into a Good College?
Top 20 Universities
25th Percentile ACT Scores of Accepted Students
75th Percentile ACT Scores of Accepted Students
Acceptance Rate
Princeton University
33
35
5.8%
Harvard University
33
35
4.6%
Columbia University
33
35
5.3%
Massachusetts Institute of Technology
34
36
6.7%
Yale University
33
35
5.9%
Stanford University
32
35
4.4%
University of Chicago
33
35
6.2%
University of Pennsylvania
33
35
7.7%
Northwestern University
32
35
8.9%
Duke University
33
35
7.4%
Johns Hopkins University
33
35
9.2%
California Institute of Technology
35
36
6.4%
Dartmouth College
32
35
7.9%
Brown University
31
35
6.6%
University of Notre Dame
33
35
8.2%
Vanderbilt University
33
36
9.1%
Cornell University
32
35
10.6%
Rice University
33
35
8.7%
Washington University in St. Louis
33
35
14%
University of California—Los Angeles
25
33
12.3%
Top 20 Liberal Arts Colleges
25th Percentile ACT Scores of Accepted Students
75th Percentile ACT Scores of Accepted Students
Acceptance Rate
Williams College
31
35
12.4%
Amherst College
30
34
13%
Swarthmore College
31
34
8.7%
Wellesley College
30
34
20%
Pomona College
32
35
8%
Bowdoin College
32
34
8.9%
Carleton College
31
34
7.3%
Claremont McKenna College
30
34
9.3%
Middlebury College
32
33
16%
Washington and Lee University
32
34
18.6%
Colby College
31
33
9.6%
Haverford College
31
34
16.1%
Smith College
28
31
31.9%
Grinnell College
30
33
24%
Hamilton College
32
34
16.1%
Vassar College
32
34
23.4%
Colgate University
31
34
22.3%
Davidson College
30
33
18.3%
United States Naval Academy
27
33
8.5%
Wesleyan University
33
35
16.4%
How is the ACT Scored?
When Will My Results Be Available?
How Can I Access My Scores?
What Does My ACT Score Report Mean?
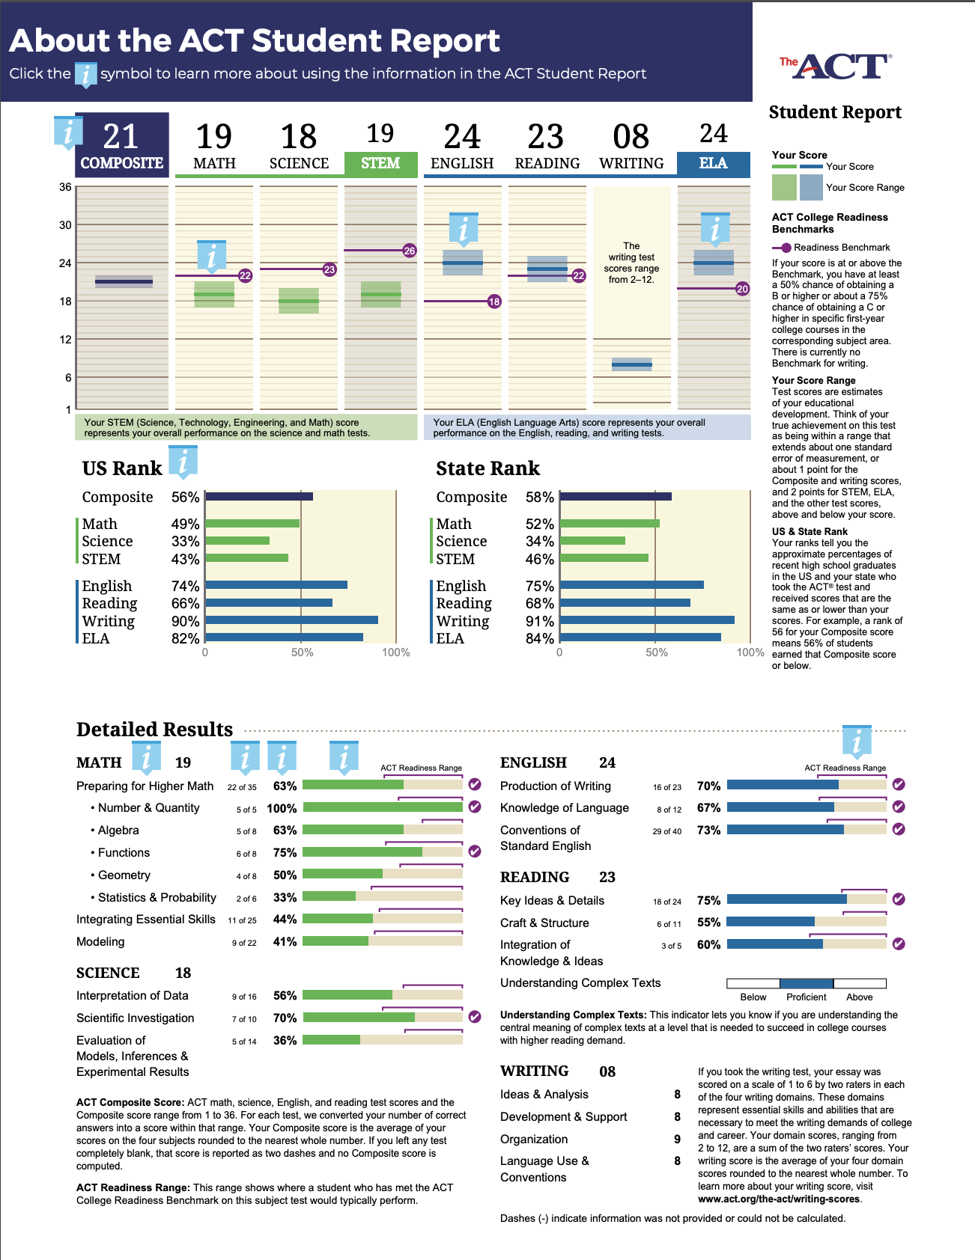 Image courtesy of ACT
Readiness Benchmarks

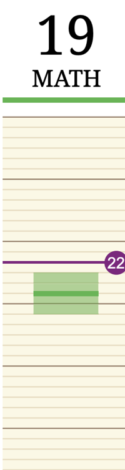
Understanding Your Math Score
Decoding Your Science Score

The STEM Score

Making Sense of Your English Score

Breaking Down Your Reading Score

The ELA Score

How to Interpret Your Writing Score

Composite Scores
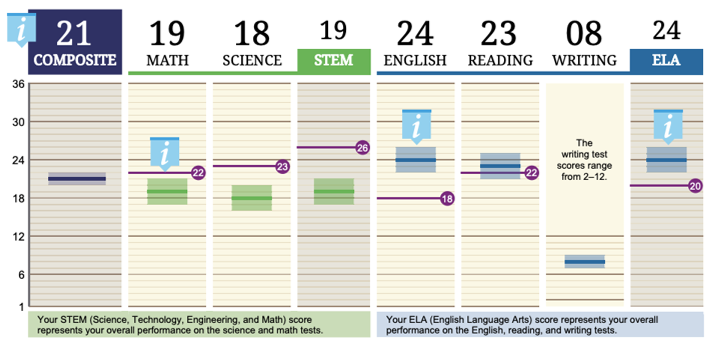
Image courtesy of ACTACT Score Percentiles, or State and National Rankings
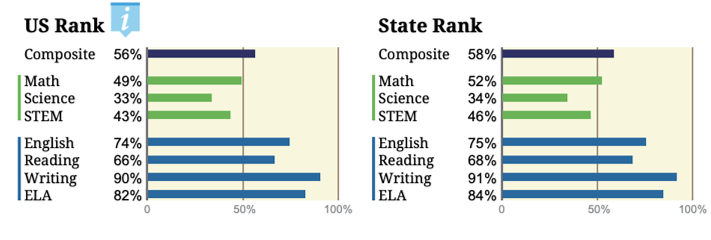
Detailed Results
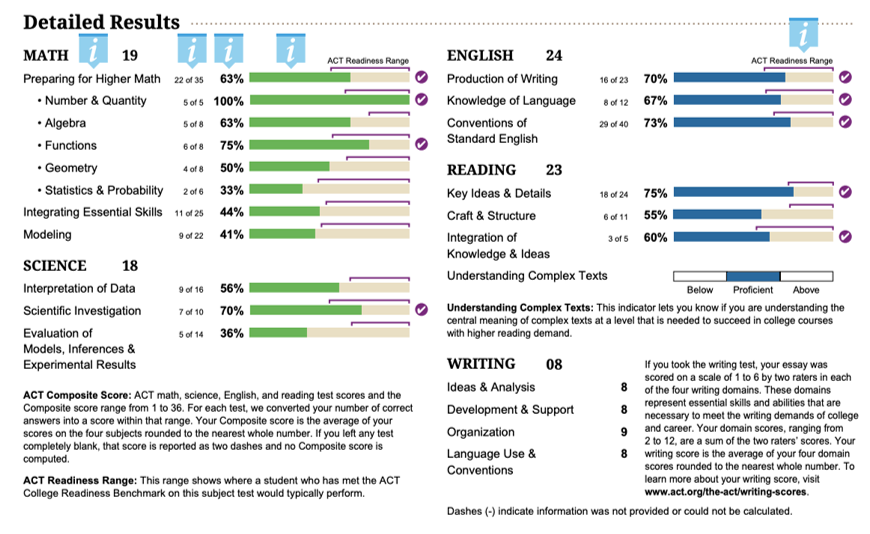 Image courtesy of ACT
College and Career Planning
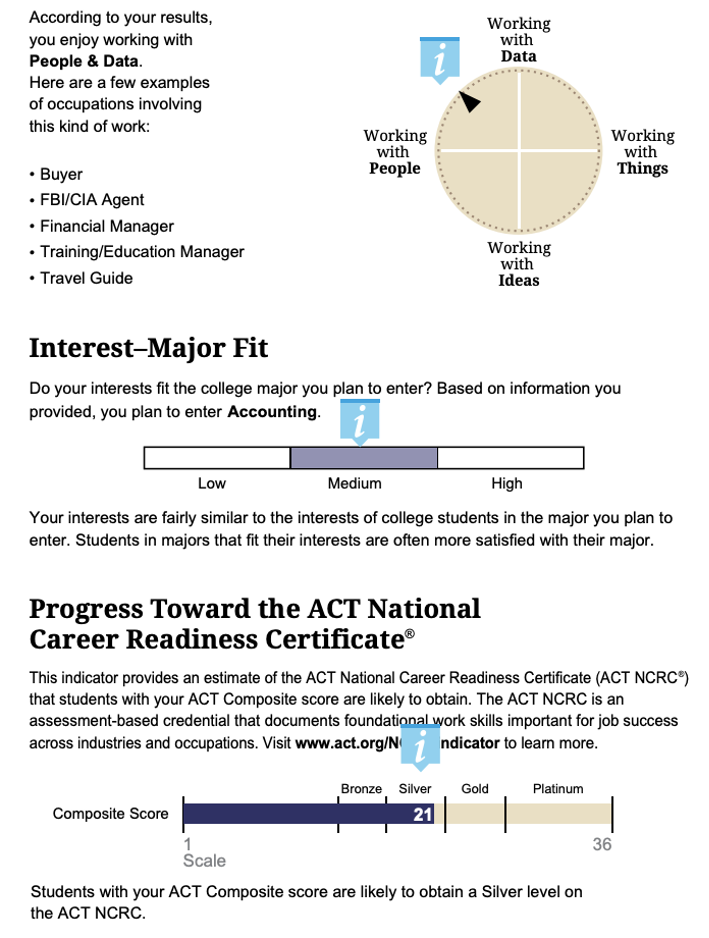
Image courtesy of ACT