New SAT vs. Old SAT Score Conversion Chart


What’s Covered:
- New SAT to Old SAT Conversion Chart
- Explanation of Methodology
- How Does Your SAT Score Impact Your College Chances?
The new SAT scoring system placed the process of interpreting scores into uncharted territory. Before March 2016, the test was out of 2400, but the new test is out of 1600. If you’re wondering how your score stacks up to the old test, or how your old score converts to the new test, check out the chart below for a comparison of scoring scale and percentile ranges!
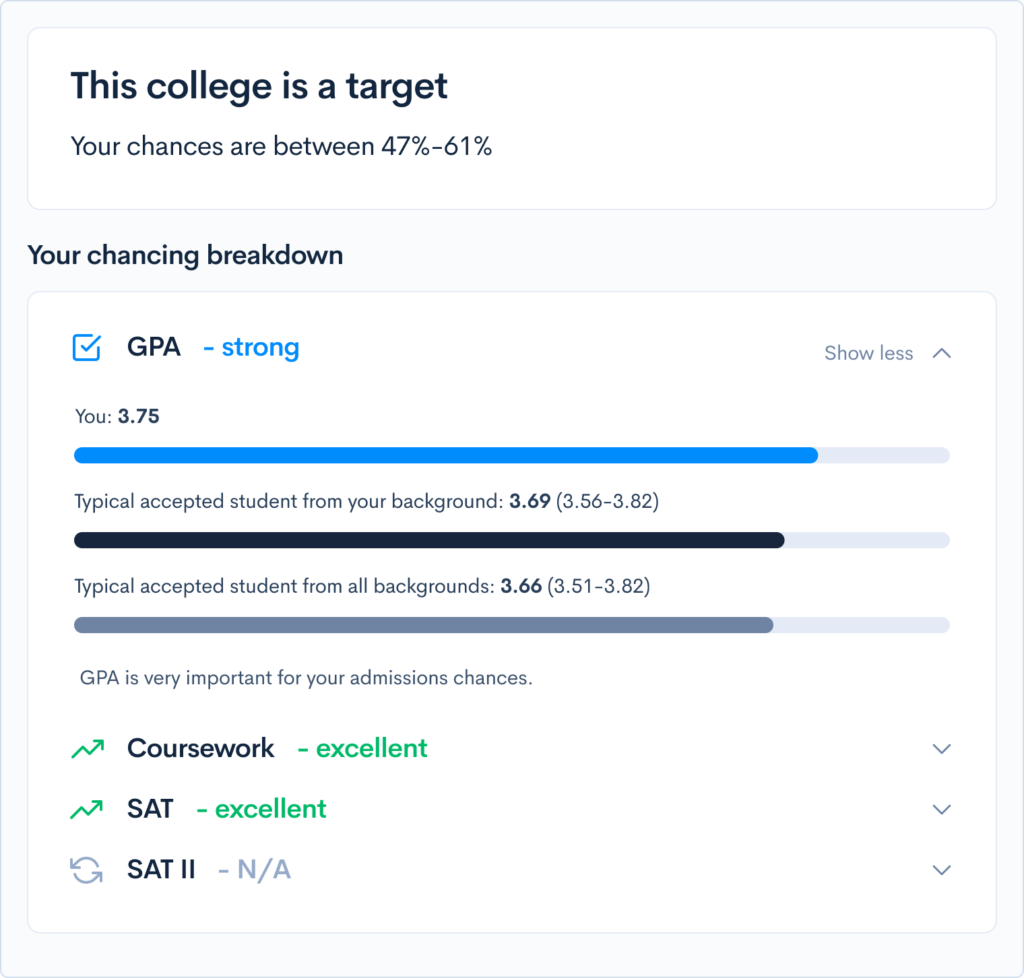
Is your SAT score strong enough to get into your dream school? Calculate your chances of admission using our free chancing calculator.
What Exactly Changed?
The old SAT was out of 2400 and had three sections out of 800: Math, Critical Reading, and Writing.
The new SAT combines the former Critical Reading and Writing sections into a single section called Evidence-Based Reading and Writing. This section has a Reading test and Writing and Language test.
The Essay also became optional and was separated from the composite score (previously it factored into your Writing score). As of June 2021, the SAT Essay is actually discontinued.
The New to Old SAT Score Conversion Chart
| 1600 Score | 600-2400 Equivalent Scores | 1600 Percentiles |
| 1600 | 2400 | 99 |
| 1590 | 2390 | 99 |
| 1580 | 2390 | 99 |
| 1570 | 2380 | 99 |
| 1560 | 2360 OR 2370 | 99 |
| 1550 | 2350 | 99 |
| 1540 | 2330 OR 2340 | 99 |
| 1530 | 2320 | 99 |
| 1520 | 2300 OR 2310 | 99 |
| 1510 | 2290 | 99 |
| 1500 | 2270 OR 2280 | 99 |
| 1490 | 2250 OR 2260 | 99 |
| 1480 | 2240 | 99 |
| 1470 | 2220 OR 2230 | 98-99 |
| 1460 | 2210 | 98 |
| 1450 | 2190 OR 2200 | 98 |
| 1440 | 2180 | 98 |
| 1430 | 2160 OR 2170 | 98 |
| 1420 | 2150 | 97 |
| 1410 | 2130 OR 2140 | 97 |
| 1400 | 2120 | 97 |
| 1390 | 2100 OR 2110 | 96 |
| 1380 | 2090 | 96 |
| 1370 | 2070 OR 2080 | 95-96 |
| 1360 | 2060 | 95 |
| 1350 | 2040 OR 2050 | 94-95 |
| 1340 | 2030 | 94 |
| 1330 | 2010 OR 2020 | 93 |
| 1320 | 2000 | 92 |
| 1310 | 1980 OR 1990 | 92 |
| 1300 | 1970 | 92 |
| 1290 | 1950 OR 1960 | 91 |
| 1280 | 1940 | 90 |
| 1270 | 1920 OR 1930 | 89-90 |
| 1260 | 1910 | 89 |
| 1250 | 1890 OR 1900 | 87-88 |
| 1240 | 1880 | 87 |
| 1230 | 1860 OR 1870 | 86 |
| 1220 | 1850 | 85 |
| 1210 | 1830 OR 1840 | 84 |
| 1200 | 1820 | 83 |
| 1190 | 1800 OR 1810 | 81-82 |
| 1180 | 1790 | 81 |
| 1170 | 1780 OR 1770 | 79-80 |
| 1160 | 1750 or 1760 | 77-78 |
| 1150 | 1740 | 77 |
| 1140 | 1720 OR 1730 | 75-76 |
| 1130 | 1710 | 74 |
| 1120 | 1690 OR 1700 | 72-73 |
| 1110 | 1680 | 71 |
| 1100 | 1660 OR 1670 | 69-70 |
| 1090 | 1650 | 68 |
| 1080 | 1630 OR 1640 | 66-67 |
| 1070 | 1620 | 65 |
| 1060 | 1600 OR 1610 | 63-64 |
| 1050 | 1590 | 62 |
| 1040 | 1570 OR 1580 | 60-61 |
| 1030 | 1560 | 59 |
| 1020 | 1540 OR 1530 | 56-57 |
| 1010 | 1530 | 55 |
| 1000 | 1510 OR 1520 | 53-54 |
| 990 | 1500 | 52 |
| 980 | 1480 OR 1490 | 49-50 |
| 970 | 1470 | 48 |
| 960 | 1460 OR 1450 | 46-47 |
| 950 | 1440 | 44 |
| 940 | 1420 OR 1430 | 42-43 |
| 930 | 1410 | 41 |
| 920 | 1390 OR 1400 | 38-40 |
| 910 | 1380 | 37 |
| 900 | 1360 OR 1370 | 35-36 |
| 890 | 1350 | 34 |
| 880 | 1330 OR 1340 | 31-32 |
| 870 | 1320 | 30 |
| 860 | 1300 OR 1310 | 28-29 |
| 850 | 1290 | 27 |
| 840 | 1270 OR 1280 | 25-26 |
| 830 | 1250 OR 1260 | 23-24 |
| 820 | 1240 | 22 |
| 810 | 1220 OR 1230 | 20-21 |
| 800 | 1210 | 19 |
| 790 | 1190 OR 1200 | 17-18 |
| 780 | 1180 | 16 |
| 770 | 1160 OR 1170 | 14-15 |
| 760 | 1150 | 14 |
| 750 | 1130 OR 1140 | 12-13 |
| 740 | 1120 | 11 |
| 730 | 1100 OR 1110 | 10-11 |
| 720 | 1090 | 10 |
| 710 | 1070 OR 1080 | 8-9 |
| 700 | 1060 | 8 |
| 690 | 1040 OR 1050 | 7 |
| 680 | 1030 | 6 |
| 670 | 1010 OR 1020 | 6 |
| 660 | 1000 | 5 |
| 650 | 980 OR 990 | 5 |
| 640 | 970 | 4 |
| 630 | 950 OR 960 | 4 |
| 620 | 940 | 3 |
| 610 | 920 OR 930 | 3 |
| 600 | 910 | 3 |
| 590 | 890 OR 900 | 2 |
| 580 | 880 | 2 |
| 570 | 860 OR 870 | 2 |
| 560 | 850 | 2 |
| 550 | 830 OR 840 | 1 |
| 540 | 820 | 1 |
| 530 | 800 OR 810 | 1 |
| 520 | 790 | 1 |
| 510 | 770 OR 780 | 1 |
| 500 | 750 OR 760 | 1 |
| 490 | 740 | 1 |
| 480 | 720 OR 730 | 1 |
| 470 | 710 | 1 |
| 460 | 690 OR 700 | 1 |
| 450 | 680 | 1 |
| 440 | 660 OR 670 | 1 |
| 430 | 650 | 1 |
| 420 | 630 OR 640 | 1 |
| 410 | 620 | 1 |
| 400 | 600 OR 610 | 1 |
Explanation of Methodology
Standardized tests are a useful way to determine a student’s ability, relative to that of his or her peers, because the tests are designed such that there will always be an equal ratio of high scores to medium scores to low scores. This allows us to assign each score a percentile — a figure that represents where a score sits on a distribution curve.
For example, obtaining a perfect score on the old SAT (2400) puts you in the 99th percentile, meaning you scored higher than 99% of all other test takers. An 800, the lowest possible score on the 2400 scale, would be in the 1st percentile, meaning you scored higher than 1% of the other test takers.
In order to make our score and percentile conversion chart, we worked under the assumption that the College Board is aiming to keep the old SAT distribution similar to the new one (with a few at the top, lots in the middle, and few at the bottom).
It’s difficult to compare scores on the old SAT and the redesigned version. Once comprised of two sections (Critical Reading and Writing, that amounted to 1600 total points) has now been compressed into one section (English), amounting to 800 total points. To create the percentile conversions, we took a blended average of the Critical Reading and Writing percentiles (adjusted for the relative frequency of Critical Reading and Writing questions on the new version).
Because the scoring scale of the Mathematics section has not been altered, we used the same percentile distribution as the old SAT.
To convert score percentiles on the 2400 scale to those on the 1600 scale, we assumed the distribution of scores on both tests would be the same and compressed the 2400 values to a 1600 scale.
How Does Your SAT Score Impact Your College Chances?
Selective colleges use a metric called the Academic Index (AI) to represent the strength of applicants’ grades and test scores. If your AI is too low, a school may not even review the rest of your application.
We’ve made it easy to understand the impact of your SAT score by creating a free Admissions Chances Calculator. This calculator will let you know how your score stacks up against other applicants’, and give you tips on improving the rest of your profile, including grades and extracurriculars.
You can also search for schools based on preferences like location, major, cost, and more. Give it a try to get a jumpstart on your college strategy.